
A company's tech stack tells you more about buying readiness than almost any other data point. A company that just added a data warehouse is about to need tools that plug into it. A company running three overlapping project management apps has someone frustrated and shopping for a replacement.
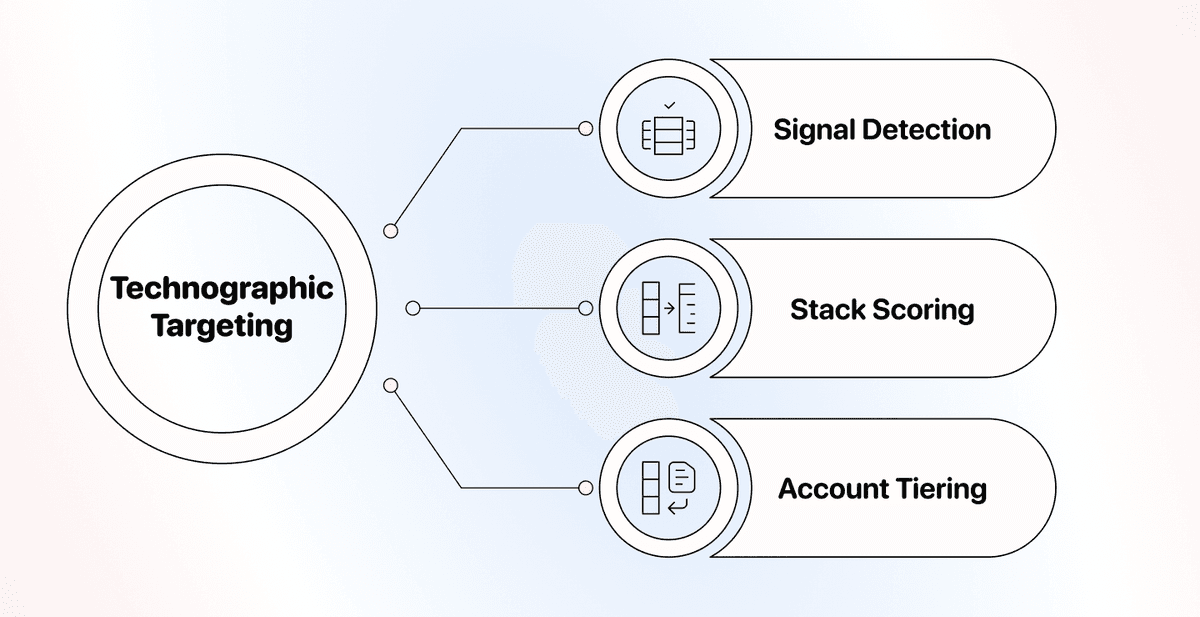
Technographic targeting turns these signals into a repeatable way to find and rank accounts, instead of guessing from firmographics alone.
This piece covers what technographic data is, where to source it, how to build a scoring model around it, and the mistakes that quietly waste a sales team's time.
📌 Summary For Those In a Rush
What this article covers: Technographic targeting uses a company's tech stack, its CRM, marketing tools, and infrastructure, to find and rank the accounts most ready to buy.
Key takeaways:
- Stack data shows buying readiness that firmographics and intent data can't capture on their own.
- No single source covers the full stack; website scanners, job postings, and vendor databases each fill different gaps.
- A simple point-based scoring model turns raw tool detections into a ranked, actionable account list.
Bottom line: The teams that get the most out of technographic targeting are the ones that keep the data clean, current, and scored consistently.
What Technographic Targeting Actually Means
Technographics are data points about the software, platforms, and infrastructure a company runs: CRMs, marketing automation, payment processors, analytics tools, CDNs, e-commerce platforms, and dozens of other categories.
Technographic targeting uses that stack data to decide who to sell to, and in what order. It sits alongside two other pillars of account-based prioritization:
- Firmographics: industry, headcount, revenue
- Intent data: content downloads, website visits
- Technographics: the tools running under the hood
The difference is specificity. Firmographics describe a company's shape. Intent data describes its attention. Technographics describe its actual operating environment, which puts you much closer to a real, addressable problem.
Why the Tech Stack Beats Firmographics Alone
Firmographics Tell You Who Could Buy
A filter like "SaaS companies, 50–500 employees, North America" gives you a large pool of plausible buyers. It doesn't tell you which of those companies actually have the problem your product solves.
Two companies can share identical firmographics and sit in completely different buying situations. One already has a mature solution in place. The other is stitching the same job together with spreadsheets and a part-time contractor.
That's why firmographic-only lists tend to flatten reply rates. A rep working a "50–500 employee SaaS" list can't open the conversation differently for a company that's solved the problem versus one actively struggling with it. The list itself carries no signal either way. Every account gets the same generic first message.
Technographics Tell You Who's Ready Now
Stack data closes that gap. If you sell a Shopify plugin, knowing a company runs Shopify Plus instead of BigCommerce is a hard qualifier, not a nice-to-have. If your tool integrates with Snowflake, a company that adopted Snowflake last quarter is a far warmer account than one still running an on-prem warehouse.
Technographic data also surfaces competitive displacement opportunities. A company using a legacy tool in your category, especially one that's stopped shipping major updates, is a candidate for a switch, not just a first-time sale.
Where Technographic Data Actually Comes From
There's no single source of truth for a company's stack. A solid approach blends a few of these:
- Website scanning tools (BuiltWith, Wappalyzer): detect front-end tech like analytics pixels, CDNs, CMS platforms, and payment widgets by reading a site's public code
- Vendor-reported data (HG Insights, G2, Datanyze): aggregated from IT asset management tools, vendor partnerships, and self-reported reviews
- Job postings: a listing for a "Salesforce administrator" or "Snowflake data engineer" is a direct, current signal of what a company runs, and often what it's expanding
- DNS and SSL records: reveal hosting providers, email infrastructure, and security vendors
- Case studies and press releases: vendors publish customer logos, which is reliable if incomplete
- Support forums and community threads: engineers troubleshooting in public often name their exact stack
No single source covers everything. Website scanners miss internal tools that never touch the front end, like CRMs or data warehouses. Job postings lag actual adoption. Two or three sources together get you meaningfully more coverage than one.
Coverage and Freshness Are Different Problems
It helps to separate two questions people usually collapse into one: does a source detect a tool at all, and how current is that detection once it exists?
Website scanners are usually fresh (they can re-crawl weekly) but shallow, since they only see what's exposed in public code. That rules out most back-office software. Vendor-reported databases go deeper, often catching internal tools like CRMs and warehouses, but update slower, sometimes quarterly, since that data tends to come from partner integrations or periodic surveys rather than live crawling.
The practical takeaway: use fast, shallow sources to catch timing signals (a new pixel or CDN this month), and slower, deeper sources to establish the baseline stack. Neither alone gives you an accurate, current picture.
Building a Technographic Signal Framework
Raw stack data is just a list of tool names until you organize it into signals you can act on.
Category-Level vs. Specific-Tool Signals
Start by deciding whether you care about the category or the specific vendor. If your tool connects to "any CRM," category-level detection (they have a CRM) is enough. If you only integrate with HubSpot, you need vendor-specific detection.
Category-level signals cast a wider net and are easier to detect reliably. Vendor-specific signals are sharper, but require cleaner data, since misclassifying a company's exact CRM will quietly poison your list.
Stack Gaps as Opportunities
A gap is often as valuable as a match. If you sell a data enrichment layer, and a company has a CRM and a marketing automation platform but no enrichment tool, that gap is the sales story. Build detection logic for "has X and Y, missing Z," not just positive matches.
Stack Changes Over Time
A snapshot of a company's stack is useful. A timeline of changes is more valuable. Tools that track installs and removals over time let you flag:
- New tool adoptions: a buying window just opened
- Tool removals: a churn or dissatisfaction signal, possibly pointing at a competitor
- Simultaneous tools in one category: a likely evaluation or migration in progress
Change-based signals consistently beat static ones for timing outreach, because they point to a specific moment when a team is already making decisions.
Scoring and Prioritizing Accounts by Tech Stack
Once you have signals, turn them into a ranked list instead of a flat one. A simple point-based model works well:
- +30: uses a tool your product directly integrates with
- +20: uses a competitor with known weaknesses in a specific area
- +15: has a category gap matching your core use case
- +10: recently added or removed a relevant tool (last 90 days)
- +10: job posting mentions a role tied to your product category
- 15: uses a tool that makes your product redundant
Weighting Signals by Intent Strength
Not every signal deserves equal weight. A job posting is forward-looking (they're planning to hire someone into this) while an installed tool is a present-state fact. Weight active, installed tools higher if your sales cycle is short. Weight postings higher if you're doing longer-term account planning.
Combining Technographic, Firmographic, and Behavioral Data
Technographics work best as a layer, not a standalone filter. A practical model stacks three inputs:
- Firmographic fit (industry, size, geography) sets the eligible pool.
- Technographic score ranks that pool by stack-based buying readiness.
- Intent data (visits, downloads) breaks ties and flags active researchers.
Accounts scoring high on all three are your top tier. Accounts with strong technographic fit but no engagement yet are still worth outbound. They just need a different opening than someone who already visited your pricing page.
This tiering also shapes channel and message, not just priority order. A high-firmographic, high-technographic, low-engagement account is a good fit for a precise, stack-referencing cold email, since you have enough context to be specific without needing them to show interest first. A high-engagement account with weak technographic fit might not deserve a sales touch at all; they may just be doing competitive research, or writing a blog post that happens to mention your category.
Common Mistakes in Technographic Targeting
- Treating detection as certainty. Scanners produce false positives and negatives. A tool detected six months ago may be long gone. Refresh data regularly and treat single-source detections as a hypothesis, not a fact.
- Over-indexing on one provider. Coverage varies by industry and company size. A provider strong on enterprise SaaS might be weak on mid-market e-commerce.
- Ignoring negative signals. Teams build target lists but skip the equally useful deprioritize list: accounts already using a tool that makes yours redundant.
- Scoring every integration equally. A company using your #1 integration partner is a stronger fit than one using a partner you rarely see convert.
- Letting lists go stale. Stack data changes constantly. A quarterly refresh, at minimum, keeps scores from drifting.
- Skipping the "why" behind a detected tool. A trial account for evaluation looks identical, in most tools, to company-wide production use. Cross-check high-value detections against a second signal, like a job posting or a case study, before treating them as confirmed.
A Practical Workflow for Building a Technographic Target List
- Define the signal set. List the tools, categories, and combinations that matter, based on your best current customers' actual stacks.
- Pull raw data from two or more sources, covering both front-end (website scanning) and back-end (job postings, vendor data) signals.
- Clean and standardize vendor names. Raw data will list "Salesforce," "Salesforce.com," and "Salesforce CRM" as three separate entries if you don't normalize first.
- Apply your scoring model to rank the merged, cleaned list.
- Route by tier. High scores to reps for direct outreach, mid scores into nurture sequences, low scores filtered out.
Step 3 is where most technographic projects fall apart. Merging exports from a scanning tool, a job board scraper, and a vendor database usually means messy, duplicated, inconsistently formatted names. Cleaning that up first is what makes the rest of the model trustworthy.
A Worked Example
Take a hypothetical company selling a customer data platform (CDP) that integrates natively with Segment and Snowflake.
- An account using Segment, Snowflake, and a legacy email tool with no CDP scores high: both required integrations, plus a clear gap that matches the core use case.
- An account using Segment but a competing CDP scores moderately: good integration fit, but the category's already filled, so the pitch shifts to displacement.
- An account with no Segment or Snowflake, but three "data engineer, warehouse migration" postings in the last month scores as future-tier: not ready today, but worth a check-in next quarter.
Ranking these three differently, instead of lumping them into one "CDP prospects" list, is the entire value of technographic scoring.
Putting It Into Practice
Technographic targeting isn't a replacement for firmographic and intent data. It's a sharper lens layered on top of them. The teams that get the most out of it aren't the ones with the fanciest detection tooling. They're the ones disciplined about refreshing data, normalizing vendor names before scoring, and updating signal weights as their own product and integrations evolve.
Start small: pick the two or three tools or categories that best predict your current customers, build detection for those first, and expand the model once it's actually driving better conversations.